See this update about this work.
In our previous report led by Martin Neil, we showed that ONS England data from November did NOT support vaccine efficacy claims once we adjust for obvious anomalies in the ONS data. Some, including the ONS themselves in their December report, imply that our conclusions were wrong because the anomalies we identified are caused by the so-called "healthy vaccinee" effect.
We examined the new ONS data and found NO evidence to support this claim. We have therefore produced a new and significantly revised report with our updated analysis.
The healthy vaccinee effect is the hypothesis that people closer to death are too ill to be vaccinated and so become concentrated in a shrinking unvaccinated population, thus increasing the group’s mortality rate. This hypothesis to explain their anomalous data is stated on Page 5 of the ONS report:
Page 5: “The all-cause ASMRs for the year-to-date were lower in the first three weeks after a vaccine dose than in subsequent weeks after that dose. This could be because of a “healthy vaccinee effect” where people who are ill (either due to COVID-19 or another relevant illness) are likely to delay vaccination. Therefore, the people who have been recently vaccinated are, in the short term, in better health than the general population.”
However, this not only contradicts NHS guidance report ("Joint Committee on Vaccination and Immunisation: advice on priority groups for COVID-19 vaccination", Page 3), which states:
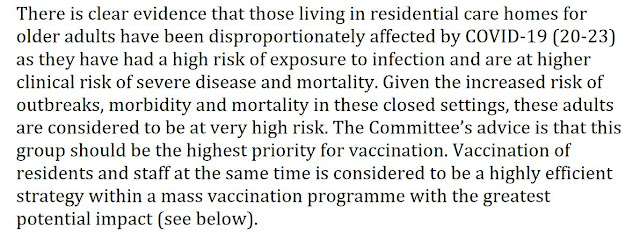
but is also contradicted by ONS on page 8 of their own report:
Page 8: "…the vaccination roll-out was also prioritised by health status of individuals, with the extremely clinically vulnerable and those with underlying health conditions being vaccinated earlier…”
If the ONS hypothesis was correct then we would see:
a) The percentage of the unvaccinated in poor health rise as vaccine rollout progresses
b) A steady non-Covid mortality rate among the unhealthy (because they are dying at same rate as they always have done).
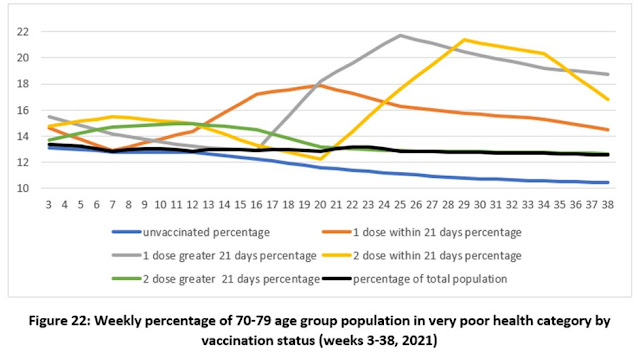
To support their claim the ONS released the percentage of 70-79 age group with "very poor" health in each vaccination category. Oddly, the vaccinated population contains a higher percentage of those in very poor health and this increases over time. Surprisingly the unvaccinated population has the LOWEST concentration of the unhealthy and the percentage declines over time:
In this unhealthy sub-population we found the non-Covid mortality rate for the unvaccinated is HIGHER than for the vaccinated. Both rates should be equivalent Again, we see unnatural spikes in non-Covid mortality just after vaccine roll out as seen before in whole population:
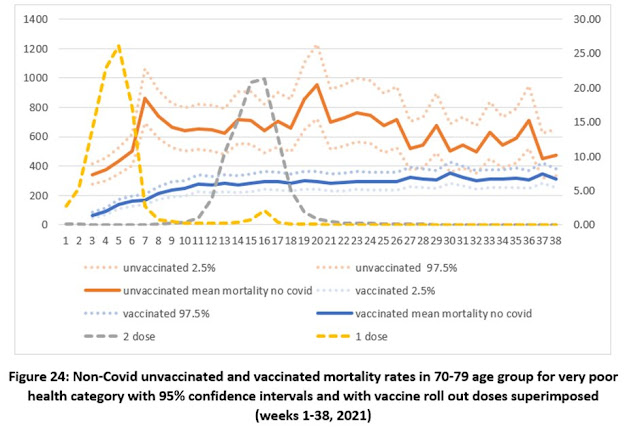
Therefore, those in poorest health were NOT more likely to remain unvaccinated. Also, there is a rise in non-Covid mortality, coincidental with vaccine rollout that is not only seen in the population as a whole but is also seen in those with the poorest health.
We conclude that the "healthy vaccine effect" cannot explain the anomalies we discovered in the ONS data and believe it is up to advocates for this hypothesis to now prove their case using the released data.
Full report:
Martin Neil, Norman Fenton, Joel Smalley, Clare Craig, Joshua Guetzkow, Scott McLachlan, Jonathan Engler, Dan Russell and Jessica Rose (2021), “Official mortality data for England suggest systematic miscategorisation of vaccine status and uncertain effectiveness of Covid-19 vaccination”, (this is a significantly revised version of http://dx.doi.org/10.13140/RG.2.2.14176.20483)
Full url: https://www.researchgate.net/publication/357778435_Official_mortality_data_for_England_suggest_systematic_miscategorisation_of_vaccine_status_and_uncertain_effectiveness_of_Covid-19_vaccination
I follow your work with great interest. Thank you.
ReplyDeleteProbability And Risk: Debunking The Hypothesis That The "Healthy Vaccinee" Effect Explains Anomalies In Ons Mortality Data >>>>> Download Now
Delete>>>>> Download Full
Probability And Risk: Debunking The Hypothesis That The "Healthy Vaccinee" Effect Explains Anomalies In Ons Mortality Data >>>>> Download LINK
>>>>> Download Now
Probability And Risk: Debunking The Hypothesis That The "Healthy Vaccinee" Effect Explains Anomalies In Ons Mortality Data >>>>> Download Full
>>>>> Download LINK yp
Very interesting. Thank you. Some thoughts:
ReplyDelete1) Effects are likely bidirectional. Sick people may be prioritized, as well as some sick being passed over at the same time. But it is clear from your charts that the prioritization of sick people in that age group is the dominating direction.
2) This may not however hold true for younger age groups. Would be interesting to explore.
3) As one commenter noted, there is a study which seemed to correctly classify vaccination status and still found all-cause mortality benefit:
https://www.medrxiv.org/content/10.1101/2021.05.27.21257583v1
https://twitter.com/covidacc/status/1481616196055146506
May be fruitful to explore.
4) I think it may be useful to respond to this individual’s criticism:
https://twitter.com/FactsThen/status/1481609452180721671
I look with interest to developments in this work. Thanks again.
https://jdee.substack.com/p/dying-with-precision-causal-vs-co
ReplyDeleteAn interesting anomaly in ONS data noted by "John Dee".
I find ONS cumulative 1st dose status population to w/e 19th Feb 2021 is missing 2.2 million persons, when compared with NHS Statistics daily/weekly 1st dose vaccination data to the 19th Feb 2021.
ReplyDeleteMore information is in my twitter post:
https://twitter.com/psiencequest/status/1483403284907974656?s=21
I was looking for a way to validate ONS vaccine status populations to look for Fenton's vaccine status lag, using raw vaccine dose data, *before* it has been given a vaccine status by ONS. Without access to NIMS, it occurred to me that I could use the NHS Statistics Daily/Weekly Vaccinations Archive.
It would be good if someone more experienced could recheck my figures, to confirm that I'm correct. I'm not a statistician, and there may be something I've overlooked.
Thanks.
On the systematic miscategorisation, Massachusetts has started publishing raw death data, and has said vaxed deaths may be an underestimate due to miscategorising deaths as unvaxed, due to an:
ReplyDelete'inability to match records across systems. Hospitalization data is likely also undercounted as identification and reporting of hospitalized cases relies on that information being obtainable by case investigators through patient interview'.
Wouldn't this apply to the UK too?
This is underlined by the findings of Prof. Kuhbander as stated in here (in German): https://t.me/QuakDr/1956
ReplyDeleteStill have no original link, as this research is not finalized.
Probability And Risk: Debunking The Hypothesis That The "Healthy Vaccinee" Effect Explains Anomalies In Ons Mortality Data >>>>> Download Now
ReplyDelete>>>>> Download Full
Probability And Risk: Debunking The Hypothesis That The "Healthy Vaccinee" Effect Explains Anomalies In Ons Mortality Data >>>>> Download LINK
>>>>> Download Now
Probability And Risk: Debunking The Hypothesis That The "Healthy Vaccinee" Effect Explains Anomalies In Ons Mortality Data >>>>> Download Full
>>>>> Download LINK X2
Appreciate you for sharing this blog. A must read post here. thanks... MM
ReplyDeleteThis is also a very good post which I really enjoy reading. Do another one man... MM
ReplyDeleteHi! This is my first visit blog! Useful information, great. Thank you so much.. MM
ReplyDeleteI will be sure to read more of this useful magnificent information. Thanks... MM
ReplyDeleteExtremely helpful info. I love this information. Thank you and best of luck... MM
ReplyDelete
ReplyDeleteThanks for sharing valuable information
ReplyDeleteI am very happy when reading this blog post because blog post written in good manner and write on good topic.
ReplyDeleteGood text Write good content success. Thank you
ReplyDeleteVery cool article, it's very interesting to see if the commenting on blogs works
ReplyDeleteYour article has continually got a lot of really up to date info.