Monday 24 January 2022

Computing years of lost life: why actuaries really need to be able to do counterfactual reasoning

Hugh Osmond recently put out this interesting twitter thread:


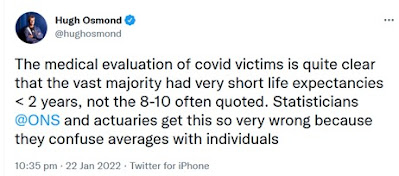
Although the average age of death in the UK is around 82, if a person reaches 82 then on average (i.e. without knowing any details of the particular person) the person can expect to live about another 8 years. We know the average age of a person dying from Covid is also 82, so it seems reasonable to assume that a typical person dying from Covid loses 8 life years. But, as Hugh points out, this reasoning is flawed. Hugh provides what is essentially an informal argument. In what follows we provide a formal explanation.

The question we are trying to answer is:

Knowing that an individual (let’s say it’s a man called Fred) has died from Covid at the age of 82, how much longer would Fred have lived if he had not got Covid?

This is a classic ‘counterfactual’ question. We want to know what would happen to Fred in an alternative world if something that happened in the real world (namely, getting Covid) was changed. And we want to take account of everything we can learn about Fred that will be unchanged in the counterfactual world from what happened in the real world. 

Crucially, because we know that Fred died of Covid, we learn from the real world that (compared to the average 82 year-old) Fred is much more likely to also have had some critical pre-existing illness. And this knowledge must be retained in the counterfactual world.

As very well explained by Judea Pearl, answering counterfactual questions requires a causal model and an inference method that are beyond what can be achieved with traditional statistical methods.  In what follows we use illustrative and simplified assumptions to explain this counterfactual reasoning.

First, we need a causal model of the ‘real world’. Such a basic causal model is shown in Figure 1.


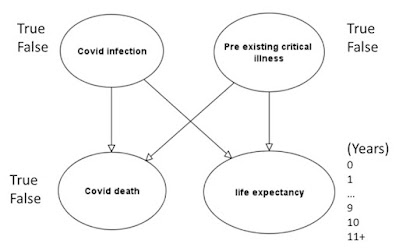
Figure 1 Basic causal model (for 82 year-olds)

This tells us that whether a person suffers a Covid death depends not just on whether the person becomes infected, but also on many other factors including whether the person has a pre-existing critical illness. Similarly, a person’s life expectancy depends on the same factors (among others).

When we assign prior probabilities to the nodes ‘Covid infection’ and ‘Pre-existing critical illness’, and conditional probabilities to the nodes ‘Covid death’ and ‘life expectancy’, then the causal model becomes a Bayesian network for which we can perform Bayesian inference.

In what follows we use the following assumed prior and conditional probabilities:

  •  Covid infection: 1%
  •  Pre-existing critical illness: 10%
  • Covid death given Covid infection is false = 0%
  •  Covid death given Covid infection and Pre-existing critical illness = 10% 
  •   Covid death given Covid infection and no Pre-existing critical illness = 0.1%
  • The full set of conditional probabilities for life expectancy is given in Table 1

Table 1 Conditional probability table for 'life expectancy'


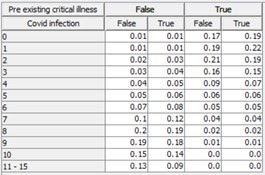
Changing any of these probability assumptions (within reason) does not change the thrust of the argument (readers are free to try out the model and make their own changes using their favourite Bayesian network software**).

With these assumptions we get the prior marginal probabilities shown in Figure 2.

Figure 2 Prior marginal probabilities

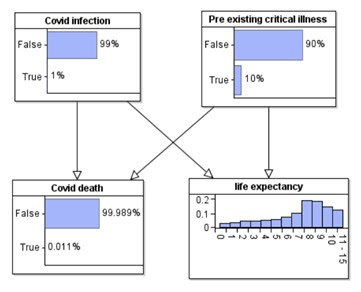
So, in the real world the median life expectancy of an average 82-year-old is 8 years.  

But, if we know that an individual dies from Covid then, while obviously this means that ‘Covid infection’ must be true,  through Bayesian inference we also get the revised probability for ‘pre-existing critical illness’ shown in Figures 3.  


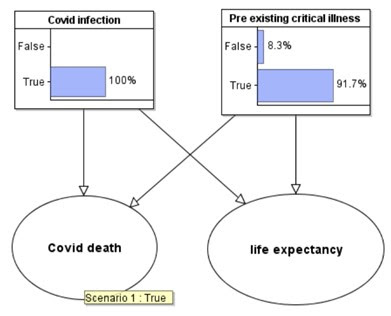
Figure 3 Revised probabilities are observing Covid death


We can now use this new information about the probability this individual has pre-existing critical illness in a counterfactual world where he is not infected with Covid. The counterfactual model required for this is shown in Figure 4.


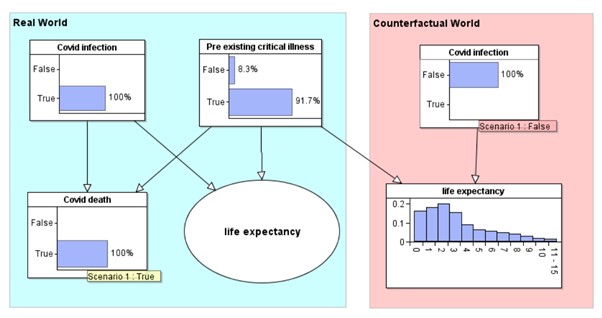
Figure 4 Counterfactual world

The ‘Covid infection’ and ‘life expectancy’ nodes in the counterfactual world are simply copies of the same named nodes from the real world model. They have exactly the same prior and conditional probability tables respectively. When we enter ‘Covid infection’ is false in the counterfactual world, we get the revised probability distribution for life expectancy. This individual has a median of 2 years life expectancy, rather than the 8 years.

The inference performed in this counterfactual model is not possible using the original model alone.

For more information on Bayesian networks and counterfactual reasoning see our book and short videos.

 **The model used here can be downloaded and run in the free trial version of AgenaRisk (we declare an interest - Directors of the company that owns the software).

 29 Jan update:  Here is a 5 minute video explanation on the above with an even simpler model (that can be downloaded by right clicking)


Thursday 13 January 2022

Debunking the hypothesis that the "healthy vaccinee" effect explains anomalies in ONS mortality data

See this update about this work. 

 In our previous report led by Martin Neil, we showed that ONS England data from November did NOT support vaccine efficacy claims once we adjust for obvious anomalies in the ONS data. Some, including the ONS themselves in their December report, imply that our conclusions were wrong because the anomalies we identified are caused by the so-called "healthy vaccinee" effect. 

We examined the new ONS data and found NO evidence to support this claim. We have therefore produced a new and significantly revised report with our updated analysis.

The healthy vaccinee effect is the hypothesis that people closer to death are too ill to be vaccinated and so become concentrated in a shrinking unvaccinated population, thus increasing the group’s mortality rate.  This hypothesis to explain their anomalous data is stated on Page 5 of the ONS report:

Page 5: “The all-cause ASMRs for the year-to-date were lower in the first three weeks after a vaccine dose than in subsequent weeks after that dose. This could be because of a “healthy vaccinee effect” where people who are ill (either due to COVID-19 or another relevant illness) are likely to delay vaccination. Therefore, the people who have been recently vaccinated are, in the short term, in better health than the general population.”

However, this not only contradicts NHS guidance report ("Joint Committee on Vaccination and Immunisation: advice on priority groups for COVID-19 vaccination", Page 3), which states: 

but is also contradicted by ONS on page 8 of their own report:

Page 8: "…the vaccination roll-out was also prioritised by health status of individuals, with the extremely clinically vulnerable and those with underlying health conditions being vaccinated earlier…

If the ONS hypothesis was correct then we would see: 

a) The percentage of the unvaccinated in poor health rise as vaccine rollout progresses 

b) A steady non-Covid mortality rate among the unhealthy (because they are dying at same rate as they always have done).

To support their claim the ONS released the percentage of 70-79 age group with "very poor" health in each vaccination category. Oddly, the vaccinated population contains a higher percentage of those in very poor health and this increases over time. Surprisingly the unvaccinated population has the LOWEST concentration of the unhealthy and the percentage declines over time:


In this unhealthy sub-population we found the non-Covid mortality rate for the unvaccinated is HIGHER than for the vaccinated. Both rates should be equivalent Again, we see unnatural spikes in non-Covid mortality just after vaccine roll out as seen before in whole population:


Therefore, those in poorest health were NOT more likely to remain unvaccinated. Also, there is a rise in non-Covid mortality, coincidental with vaccine rollout that is not only seen in the population as a whole but is also seen in those with the poorest health.  

We conclude that the "healthy vaccine effect" cannot explain the anomalies we discovered in the ONS data and believe it is up to advocates for this hypothesis to now prove their case using the released data.

Full report:

Martin Neil, Norman Fenton, Joel Smalley, Clare Craig, Joshua Guetzkow, Scott McLachlan, Jonathan Engler, Dan Russell and Jessica Rose (2021), “Official mortality data for England suggest systematic miscategorisation of vaccine status and uncertain effectiveness of Covid-19 vaccination,   (this is a significantly revised version of http://dx.doi.org/10.13140/RG.2.2.14176.20483)

Full url: https://www.researchgate.net/publication/357778435_Official_mortality_data_for_England_suggest_systematic_miscategorisation_of_vaccine_status_and_uncertain_effectiveness_of_Covid-19_vaccination 

Monday 3 January 2022

No fancy statistics: a simple plot of vaccination rate against Covid death rate for all countries in the world

Using the "Our Word in Data" website we have extracted the latest snapshot for each country of total vaccinations per hundred people and total 'covid deaths' per million. The full data by country - in order of vaccinations - is listed at the bottom of this page (all numbers rounded to 0 decimal places).

We use inverted commas for 'covid deaths' because (as readers of this blog will know) this is a very vague metric and we have no confidence that it is accurate or consistently collected for any country in the world. If the data were accurate, and if the vaccines worked as claimed, then what we should see when we plot the vaccinations against deaths is something like this:


 i.e. the more vaccinations in a country the fewer deaths.

Obviously there are multiple confounding factors (other than inconsistent reporting) that can impact on the relationship (timing when covid first hit, average population age, population density, geographial location, access to healthcare, etc) not to mention all the missing factors previously discussed**. Ideally the deaths should also be restricted to post-vaccination roll out (difficult to do that using the Our World in Data spreadsheet). But it is still surprising that the following is the actual plot:


All pretty random*** but note the high number of low vaccination, low covid death countries (mainly in Africa) as shown in this map:

But what it really shows more than anything is how poor all the 'official' covid data are (look at the laughable China data) and, because of the universally poor data, how little evidence there is of either the severity of Covid or the effectiveness of any covid interventions.

**As we have been saying since March 2020 all of the 'official' Covid data are essentially useless because they do not provide us with the necessary information to take account of all of the causal explanations for what is observed:


Country total vaccinations per hundred total deaths per million
Gibraltar 322 2968
Cuba 268 735
Chile 230 2035
United Arab Emirates 224 216
Iceland 209 108
Denmark 209 560
Isle of Man 208 784
Malta 208 922
South Korea 202 111
Uruguay 200 1771
China 197 3
Cayman Islands 196 165
Faeroe Islands 196 285
United Kingdom 195 2181
Ireland 194 1186
Portugal 191 1864
Belgium 186 2434
Seychelles 185 1324
Bahrain 185 797
Spain 184 1909
Italy 184 2278
France 183 1830
Austria 182 1520
Bermuda 182 1707
Canada 181 798
Israel 180 887
Cambodia 180 178
Brunei 179 222
Germany 178 1336
Norway 178 239
Qatar 178 211
Malaysia 176 961
Singapore 175 149
Finland 175 282
Sweden 173 1507
Cyprus 172 698
Argentina 168 2569
Greece 167 2005
Australia 165 88
Luxembourg 165 1429
Liechtenstein 165 1804
Mongolia 161 619
Kuwait 160 570
Mauritius 160 188
New Zealand 160 10
San Marino 159 2793
Japan 158 146
Switzerland 158 1397
Sri Lanka 158 698
Hungary 156 3934
Netherlands 155 1193
Brazil 155 2894
Turkey 155 968
Lithuania 154 2752
United States 153 2476
Aruba 153 1689
Ecuador 153 1881
Vietnam 151 322
Costa Rica 151 1429
Andorra 150 1719
Bhutan 148 4
Peru 148 6071
Thailand 147 309
El Salvador 147 585
Taiwan 146 36
Maldives 145 482
Saudi Arabia 144 251
Czechia 144 3374
Turks and Caicos Islands 144 586
Fiji 140 772
Slovenia 140 2693
Greenland 138 18
Iran 137 1545
Latvia 137 2443
Morocco 135 397
Panama 135 1696
Anguilla 134 264
Curacao 132 1147
Hong Kong 132 28
Dominican Republic 129 388
Monaco 126 835
Colombia 126 2533
Poland 124 2581
New Caledonia 123 971
Antigua and Barbuda 123 1195
Serbia 120 1840
British Virgin Islands 118 1282
French Polynesia 116 2251
Nicaragua 116 32
Croatia 116 3072
Oman 116 787
Uzbekistan 115 44
Estonia 115 1458
Mexico 114 2299
Slovakia 112 3046
Azerbaijan 111 818
Wallis and Futuna 108 631
Belize 105 1462
Venezuela 105 183
India 104 346
Barbados 104 904
Saint Kitts and Nevis 102 523
Cape Verde 102 625
Tunisia 102 2141
Indonesia 101 521
Montenegro 101 3844
Russia 101 2080
Trinidad and Tobago 100 2054
Rwanda 99 102
Philippines 98 463
Guyana 97 1318
Honduras 95 1037
Paraguay 95 2301
Kosovo 94 1678
Kazakhstan 92 959
Botswana 92 1020
Timor 89 91
North Macedonia 84 3752
Romania 83 3072
Suriname 83 2009
Bolivia 82 1661
Belarus 82 570
Albania 81 1116
Jordan 80 1205
Bangladesh 80 169
Laos 79 19
Bahamas 76 1796
Nepal 74 390
Pakistan 70 128
Grenada 69 1770
Ukraine 65 2354
Lebanon 65 1350
Tajikistan 64 13
Palestine 63 932
Georgia 63 3457
Guatemala 62 883
Sao Tome and Principe 62 255
Montserrat 61 201
Comoros 59 170
Myanmar 58 350
Saint Lucia 57 1600
Saint Vincent and the Grenadines 55 728
Armenia 55 2676
Bulgaria 54 4492
Egypt 51 207
Vanuatu 49 3
Zimbabwe 48 332
Bosnia and Herzegovina 48 3590
South Africa 46 1515
Mozambique 46 62
Moldova 44 2556
Jamaica 41 833
Libya 39 819
Iraq 34 586
Angola 34 52
Eswatini 34 1102
Kyrgyzstan 34 423
Lesotho 32 308
Equatorial Guinea 31 121
Namibia 29 1398
Algeria 28 139
Togo 28 29
Gabon 25 125
Ghana 24 40
Congo 23 63
Guinea 21 29
Uganda 21 69
Guinea-Bissau 21 74
Djibouti 20 189
Kenya 18 98
Cote d'Ivoire 18 26
Liberia 17 55
Central African Republic 16 21
Benin 14 13
Senegal 13 110
Afghanistan 13 183
Sudan 12 72
Sierra Leone 11 15
Gambia 11 138
Syria 10 156
Ethiopia 9 59
Somalia 9 81
Zambia 9 197
Malawi 9 120
Nigeria 7 14
Papua New Guinea 6 65
Mali 5 32
Burkina Faso 5 15
Tanzania 4 12
Niger 4 10
Cameroon 4 67
Madagascar 3 34
Yemen 3 64
South Sudan 2 12
Chad 2 11
Haiti 2 66
Burundi 0 3
Mozambique 0 22


***For those who place value in correlation coefficients for such relationships (we don't) there is a significant positive correlation of 0.31 between number of vaccines and number of deaths