As people following my blog posts and twitter will be aware, I have been arguing that using the simple plot of daily 'number of cases' (which actually means 'number testing positive') is an inappropriate way to monitor the COVID trend. This is because much of the increase in 'cases' is explained by an increase in the number of people tested, and that many of the 'positives' are either false positives or people who are asymptomatic (or who will only ever have mild symptoms). Hence I argued that a better, but still simple alternative plot, is daily 'cases per 1000 people tested'.
Many have responded by saying that it is daily COVID hospital admissions which is the key plot to focus on. It is certainly a better indicator of the COVID trend than just 'cases' and it is all plotted daily at https://coronavirus.data.gov.uk/. Here is today's plot shown on the site:
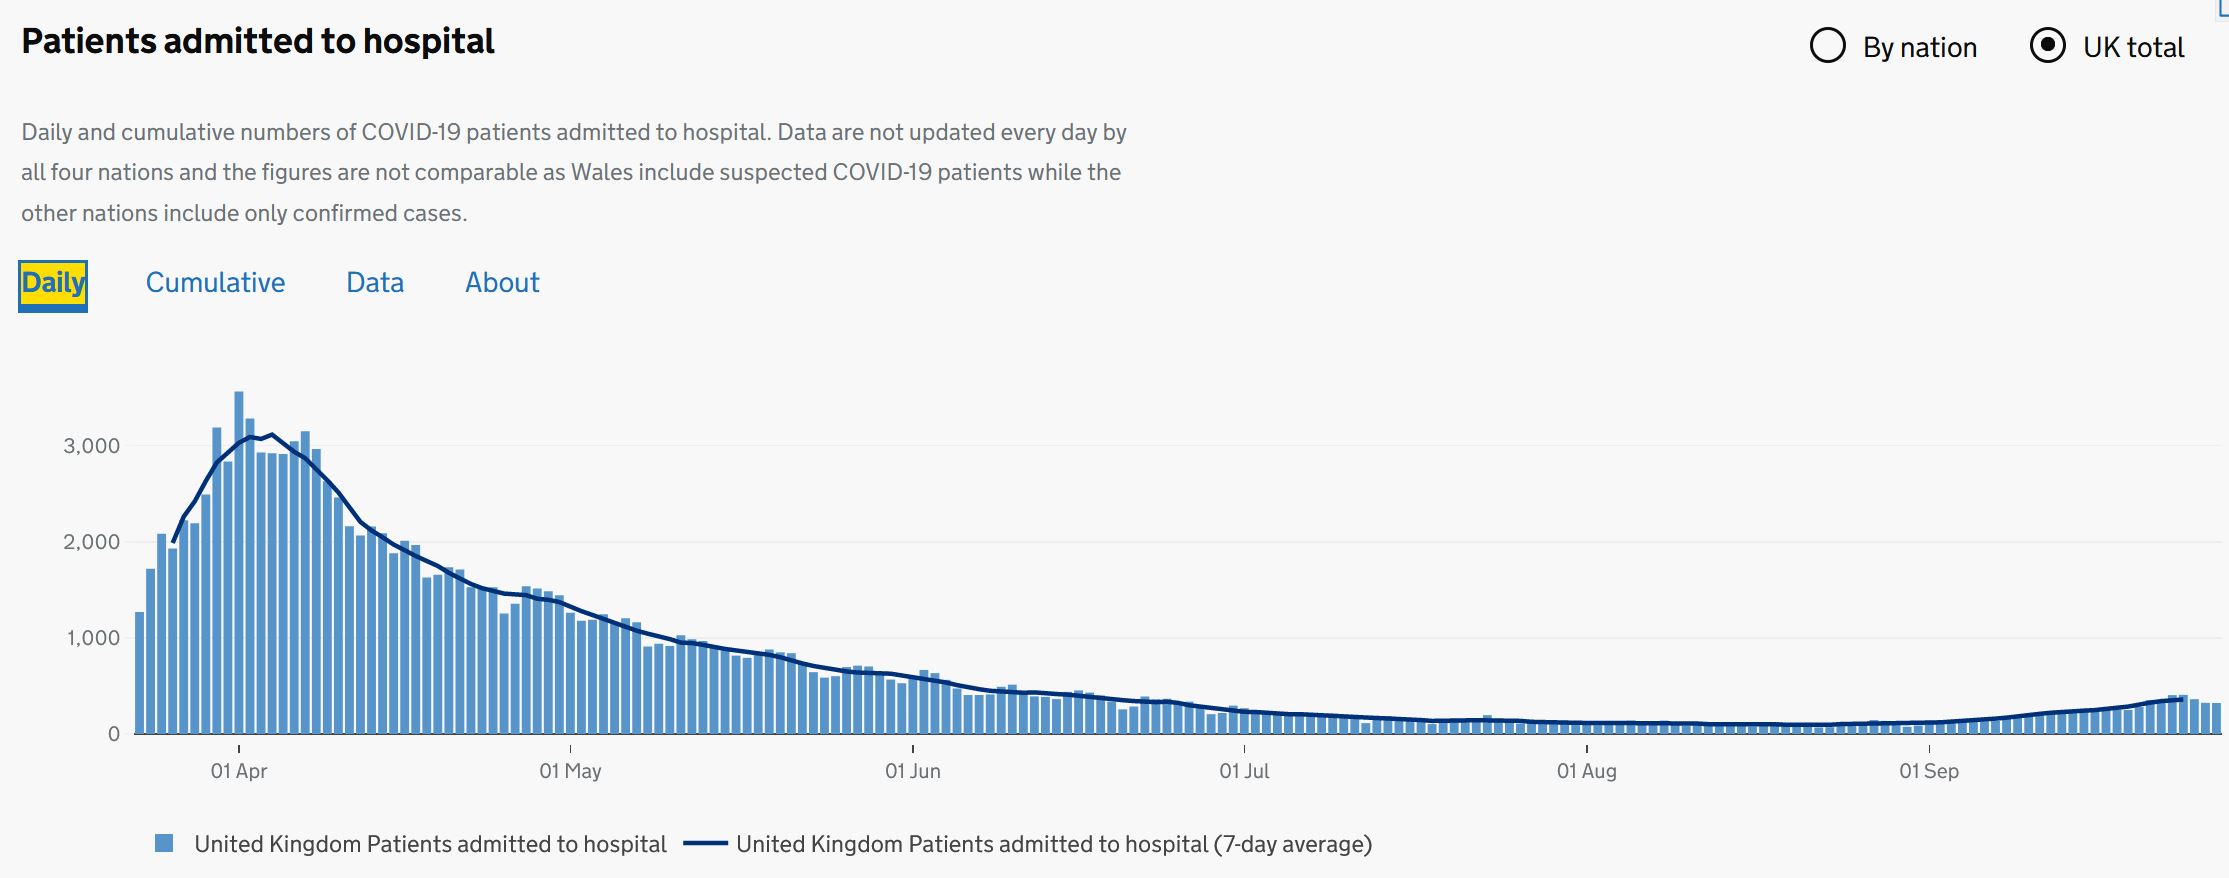
However, even if we ignore the major problem with the data for Wales (which artificially inflates the admissions data), there is still a problem in using this plot to monitor the progress of COVID. To see why, here is what the website says about the England data:
"data include people admitted to hospital who tested positive for COVID-19 in the 14 days prior to admission, and those who tested positive in hospital after admission. Inpatients diagnosed with COVID-19 after admission are reported as being admitted on the day prior to their diagnosis"
In other words, we have no idea how many of the 'COVID hospital admissions' were people actually admitted because of COVID. A person entering hospital for, say, cancer treatment who recently tested positive for COVID will be officially classified as a COVID case. The same is true of those entering hospital for any treatment who have not previously been tested positive for COVID but 'test positive' at some time during their stay. We have to therefore assume that - as in the public generally - a proportion of the 'COVID hospital admissions' are people who either a) don't have COVID; or b) are asymptomatic (or who will only ever have mild symptoms).
It also means that, as with 'COVID cases', much of the recent increase in 'COVID hospital admissions' may be explained by the general increase in number of people being tested. Unfortunately, we do not have the daily data for number of people being tested before and during UK hospital admissions. But it is not unreasonable to assume the number is roughly proportional to the total number of people being tested in the UK. So it makes sense to plot (using the data provided at https://coronavirus.data.gov.uk/) the daily hospital 'COVID admissions per 1000 people tested' in preference to simple the COVID admissions:

As data for number of people tested are only provided from 22 April, this plot does not cover the March period as in the plot above. However, you can see that the trend is similar except since 1 Sept, where the increase is more gradual. This suggest that, indeed some (but not all) of the recent increase is explained by the increase in testing.
Here is the same plot from 1 July:

And - before anybody suggests that it's "COVID deaths" not hospital admissions we should be looking at - everything I said above is also releant to those classified as COVID deaths.
See also:
- Impact of false positives in Covid testing
- Don't panic: limits to what we know about Covid-19 PC testing, inferred infection rates and alse positive rates
- A privacy-preserving Bayesian network model for personalised COVID19 risk assessment and contact tracing
Covid-19: Infection rates are higher, fatality rates lower than widely reported - Coronavirus: country comparisons are pointless unless we account for these biases in testing
- Why most studies into COVID19 risk factors may be producing flawed conclusions - and how to fix the problem
- Causal explanations, error rates, and human judgment biases missing from the COVID-19 narrative and statistics
No comments:
Post a Comment