The video and the tweet publicising it
On 26 June 2022 Susan Oliver published a video on YouTube titled “Antivaxxers fooled by p-hacking and apples to oranges comparison” in response to a preprint [1] by 8 authors, one of whom was well-know BMJ Senior Editor Peter Doshi. She refers to the paper as the “Doshi paper” and we will use the same reference here even though Doshi is the last, rather than first, named author. The paper demonstrates the increased risk of serious adverse events (SAEs) arising from the Pfizer and Moderna covid vaccine trials. Susan summarised her view of the paper in this tweet (which included the link to the video) that was retweeted by people like Prof Sir David Spiegelhalter (a world renowned expert on probability and risk) and Prof Peter Hansen (Econometrician, Data Scientist, and Latene Distinguished Professor of Economics at UNC, Chapel Hill):

What Susan says in the video and why it totally misrepresents the Doshi paper
Susan spends 3 minutes highlighting a number of people she refers to as “anti-vaxxers” who tweeted about the paper, including Jordan Peterson who she refers to as a "self-declared best-selling author" (note: his 2018 book sold over 3 million copies and was number 1 on Amazon). Susan then states:
“It’s basically just a rubbish paper that uses a technique known as p-hacking followed by some apples stuff oranges comparisons”.
Interestingly, despite the video title, Susan spends less than 30 seconds describing what p-hacking is and instead refers to a paper about it [2] (we agree entirely with the general concerns raised about p-hacking and show how it is avoided using Bayesian hypothesis testing [3]). But the key flaw in Susan's criticism is that the “Doshi paper” is not an example of p-hacking at all. They do not use p-values and, also contrary to the continued assertions of Susan, they make no claims at all of statistical significance. Rather, the paper provides risk differences and risk ratios with 95% confidence intervals (CIs) for the various different comparisons of vaccine v placebo. For example, here is their table of results for all serious adverse events (SAEs) and also of the subset of serious adverse events of special interest (serious AESIs):

If the authors had been “p-hacking” they would have chosen a p-value like 0.05 and would have added, for each comparison of vaccine v placebo, a ‘significance statistic’ and arrived at at least one example where the statistic was less than 0.05. Then they would claim, for example, that the increased SAE rate was ‘significant’. They do nothing like that at all.
Susan then claims that only by ‘combining’ the data from the different trials does Doshi get the (mythically claimed) ‘significant results’ and that such combining should simply not be done (this is one of her ‘apples and oranges’ comparison argument). But, while it is true that the paper does also look at the combined numbers for each class of SAE, it turns out that in each case, the risk ratio for the combined numbers is actually less than for the Pfizer trial alone. For example, for all SAEs the (median) risk ratio for Pfizer v placebo is 1.36 compared to just 1.15 for combined v placebo: the results are less, not more, ‘significant’. Our own Bayesian analysis of the results presented below makes this very clear.
Susan’s final criticisms of the Doshi paper concerns the selection of SAEs and the possibility of ‘double counting’. Regarding selection, the events included and not included are governed by the WHO endorsed Brighton scheme, and are not decided by the authors, so this is a critical error Susan makes. The Brighton list was created a priori, based on data before the any results were released from the trials. Any double counting, such as with the diarrhoea and abdominal pain example she uses, are a direct effect of the fact that the data are not public. There’s merit to both measures - counting number of participants (with any SAE) and number of events. If one person has two SAEs that is worse than one person having one SAE. “Double counting” sounds bad, but this is not double counting. Doshi et al are measuring how many SAEs occur in the vaccine group versus the placebo group. If Diarrhoea and abdominal pain were each recorded as a SAE, then that is two SAEs. We don’t know which ones were in the same person as Pfizer/Moderna have not released IPD. In any case, the authors recognise the issue that, because some SAEs occur in the same person, the SAEs are not all independent events; they note it in the paper, and introduce an adjustment to standard error to account for it. It is unclear whether the adjustment is sufficient, but it actually weakens their case (it increases the size of the confidence intervals) - so they can hardly be accused of bias.
Further regarding double counting, SAEs are counted individually to avoid them being hidden. So, if you get renal failure and then your penis drops off that should be two SAEs, not one. One person having three SAEs (renal failure, penis drops off, stroke) could be considered as serious as three people having a stroke; so, although some clinicians disagree, it is entirely reasonable to count SAEs separately. But Susan does not appear to understand what a SAE is. She assumes something like diarrhoea cannot be a SAE because lots of diarrhoea happens to be mild. But most covid is not serious, either. So diarrhoea can be a SAE if it’s serious enough and meets the regulatory criteria. And it’s a leading cause of death in some places.
That addresses all the ‘flaws’ that Susan claims about the
paper. It is also important to note that, even when all the SAEs in the Pfizer
and Moderna trial are combined, the absolute risk increase is fairly small - a fact already made clear by
Doshi et al. (although
this is to be balanced against the very low risks of severe covid, which is in
essence the core message of the paper). They state that, in this case, the
absolute risk increase (95% CI) is between 2.1 to 22.9 events per 10,000
participants. In our Bayesian analysis
the median absolute risk increase is 12.9 events per 10,000 participants with
CI between 0 to 27.
What it also ironic about the attack on the Doshi paper is that, just before her concluding remarks and ball juggling, Susan uncritically cites a very flawed modelling study crediting nearly 20 millions of lives saved to Covid jabs as a "rebuttal."
Bayesian analysis of the data
The benefits of applying a Bayesian analysis to the data is that we are able to ‘learn’ the full probability distributions of the adverse reaction rates for vaccine and placebo. This enables us not just to compute the risk ratios and CIs (we get slightly different results to Doshi) but, crucially, also to make explicit probabilistic statements about whether the vaccine SAE rate is higher than that of the placebo (this approach is the Bayesian alternative to the flawed p-value approach). The results (which we provide below) do indeed provide explicit support for the hypothesis that the SAE rate for vaccine is higher than that of the placebo.
Serious adverse events
|
|
Vacc AEs |
Placebo AEs |
P(Vacc AE) Median & CI |
P(placebo AE) Median & CI |
RR Median & CI |
Prob (vacc higher SAE) |
|
Pfizer |
127/18801 |
93/18785 |
0.0068 (0.0057, 0.0080) |
0.0050 (0.0040, 0.0060) |
1.362 (1.044, 1.784) |
98.86% |
|
Moderna |
206/15185 |
196/15166 |
0.01361 (0.0118, 0.0155) |
0.01297 (0.0112, 0.0148) |
1.050 (0.864, 1.275) |
68.76% |
|
Combined |
333/33986 |
289/33951 |
0.0098 (0.0088, 0.0109) |
0.0085 (0.0076, 0.0096) |
1.151 (0.983, 1.348) |
96.03% |
Serious adverse events of special interest
|
|
Vacc AEs |
Placebo AEs |
P(Vacc AE) Median & CI |
P(placebo AE) Median & CI |
RR Median & CI |
Prob (vacc higher SAE) |
|
Pfizer |
52/18801 |
33/18785 |
0.00280 (0.0021, 0.0036) |
0.00180 (0.0013, 0.0025) |
1.56 (1.016, 2.44) |
97.92% |
|
Moderna |
87/15185 |
64/15166 |
0.0058 (0.047, 0.0071) |
0.0043 (0.0033, 0.0054) |
1.37 (0.98, 1.88) |
96.85% |
|
Combined |
139/33986 |
97/33951 |
0.0041 (0.0035, 0.0048) |
0.0029 (0.0023, 0.0035) |
1.43 (1.104, 1.857) |
99.65% |
Serious adverse events of special interest matching Brighton’s list
|
|
Vacc AEs |
Placebo AEs |
P(Vacc AE) Median & CI |
P(placebo AE) Median & CI |
RR Median & CI |
Prob (vacc higher SAE) |
|
Pfizer |
39/18801 |
28/18785 |
0.0021 (0.0015, 0.0028) |
0.0015 (0.0010, 0.0022) |
1.38 (0.86, 2.26) |
90.82% |
|
Moderna |
65/15185 |
56/15166 |
0.0043 (0.0035, 0.0048) |
0.0037 (0.0029, 0.0048) |
1.16 (0.81, 1.66) |
79.04% |
|
Combined |
104/33986 |
84/33951 |
0.00308 (0.0025, 0.00371) |
0.00249 (0.002, 0.0031) |
1.24 (0.93, 1.65) |
92.57% |
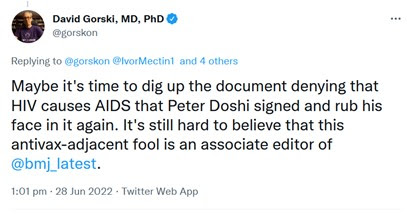
Postscrip: the vicious campaign against Peter Doshi
Following a tweet by Norman Fenton criticising the video blue checkmark ‘surgeon/scientist’ David Gorski made several replies supporting the claims of the video and then made this attack of Peter Doshi.
to which blue checkmark Steve Salzberg (“Bloomberg Distinguished Professor of BME, CS, and Biostats at Johns Hopkins University”) replied:

and was supported by Art Caplan - Professor of bioethics:

References
[1] Fraiman, J., Erviti, J., Jones, M., Greenland, S., Whelan, P., Kaplan, R. M., & Doshi, P. (2022). Serious Adverse Events of Special Interest Following mRNA Vaccination in Randomized Trials. Retrieved from https://papers.ssrn.com/sol3/papers.cfm?abstract_id=4125239
[2] Head ML, Holman L, Lanfear R, Kahn AT, Jennions MD (2015) The Extent and Consequences of P-Hacking in Science. PLoS Biol 13(3): e1002106. https://doi.org/10.1371/journal.pbio.1002106
[3] “A simple example of Bayesian hypothesis testing”, https://youtu.be/s4yCu__18Jo